I have not had time to work on my project the past year, but I have managed to do some thinking about digital filters.
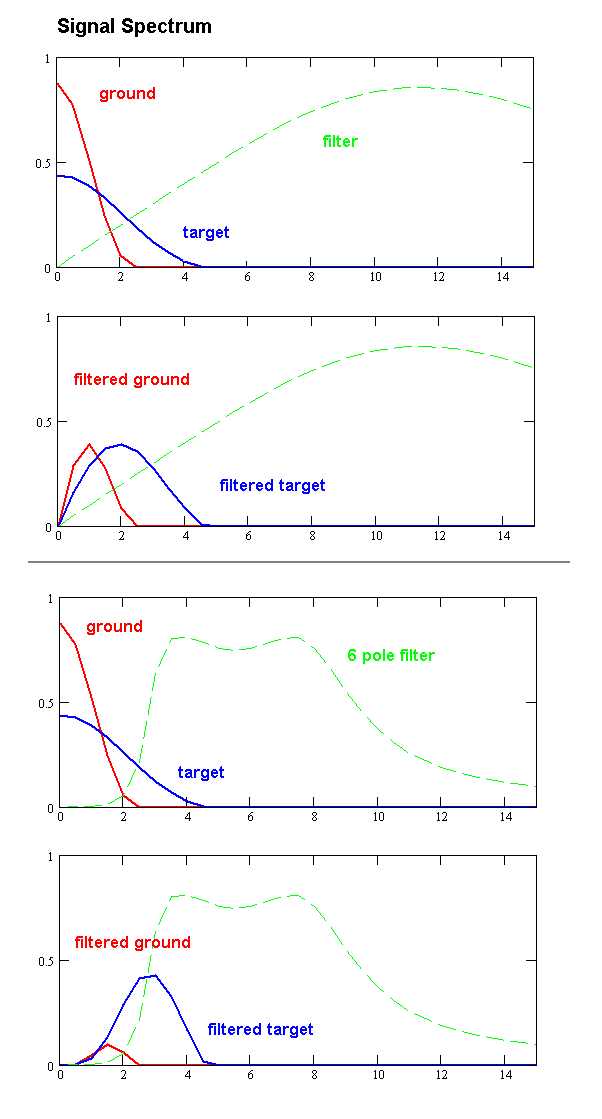
I still do not know what kind of filter response I should be aiming for. The plots above show signal frequency spectrums and two kinds of filter responses. The blue curve is the spectrum of a simple target for a concentric coil when the target is far from the coil. The horizontal axis is frequency which increases to the right. The vertical axis is amplitude. The spectrum of the target goes from DC to some maximum frequency that depends on sweep speed. As you increase sweep speed the spectrum spreads to the right. The red curve represents the spectrum of the ground signal. The ground signal generally changes more slowly than the target signal so its spectrum is farther to the left. But the ground signal is usually stronger than the target signal (for deep targets), so the curve goes higher. In some cases it is much higher than I could show on these graphs. The area under each curve is the amount of power in the signal. The green curve is a filter response curve.
The top graph has curves for the target and ground and a response curve for a simple filter. The filter response goes to zero at DC. So this filter blocks any constant ground signal and attenuates slowly changing signals. When you send a signal through a filter the signal spectrum gets multiplied by the filter response. That is, at each horizontal point on the graph you multiply the height of the signal curve by the height of the filter curve.
The second graph shows the signal curves after they have been multiplied by the filter curve. Notice that now the area under the target curve is larger than the area under the ground curve. But there is still a lot of ground signal there. One good thing about this type of filter is that it is not too sensitive to sweep speed. As the sweep speed changes the spectrums move right or left and the amplitudes increase or decrease but the target signal to ground signal ratio stays the same.
The third graph shows a sharp cutoff filter. Instead of the filter response gradually decreasing to zero, there is a sharp drop off at the filter cutoff frequency.
The fourth graph shows the signal spectrums after being multiplied by the response of the sharp cutoff filter. In this case the area under the ground curve is much smaller than the area under the target curve. But because of the sharp cutoff, the results can change suddenly when sweep speed changes. If you sweep too slowly the target spectrum moves left out from under the filter response curve and the signal goes away. If you sweep too fast the ground signal moves right and you get too much ground signal.
I am leaning towards the sharp cutoff design.
It would be nice to track the sweep speed and adjust the cutoff frequency to match the sweep speed. But I do not think I am going to have enough memory in my project to do that.
Robert
