This is actually part of a digital PI project I am working on. But I do not have a PI board set up yet so I am doing this testing on the VLF board. I was testing to see the effects of taking more than one A/D sample at each time of interest.
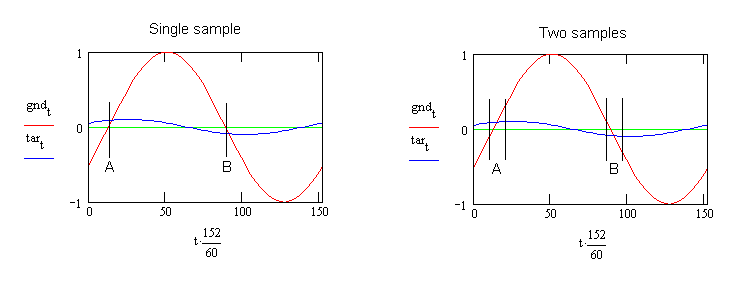
The graph on the left above shows single samples. The red curve represents the ground component of the received signal. The blue curve represents the target component of the received signal. These two components are not available as separate signals. The signal from the amplifier is the sum of these two components. By taking an A/D sample at time A, near the time when the ground component is crossing through zero I get a sample that consists mostly of target signal. I take another sample at time B. B gets subtracted from A to give one differential sample.
The graph on the right shows two samples taken about 10 microseconds apart at time A which are added together. If the timing is right, one of the A samples will have a negative ground component and the other sample will have a positive ground component. When added together most of the ground signal will cancel out. But both A samples have a positive target component, so they give a larger target signal when added together. Similarly the two B sample give mostly target signal. The sum of the B samples is subtracted from the sum of the A samples to give one differential sample.
I have not tried to measure an increase in detection range, but the signal on the scope looks noticeably better when pairs of samples are added together compared to taking single samples.
Robert
