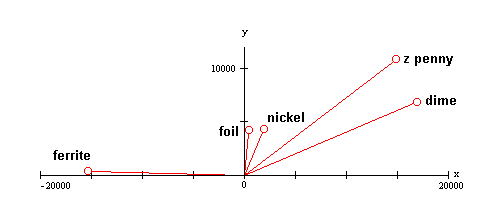
I want to be able to visualize the numbers that come out of the detector on a graph like the one above. To do that I have to calibrate the detector.
The first step was to put in an air balance function. Induction balanced coils are designed to balance out the receive signal when the coil is in the air and not near any ferrous or conductive material. But the balancing is not perfect. There is typically some signal even when there is nothing near the coil. So when I hold the coil in the air and execute the air balance function it stores the current values it is reading and then subtracts those numbers from all subsequent readings.
The next step is to calibrate the phase angle. There is some delay between the time an interrupt occurs to tell me to read the A/D and when I actually get around to doing it. There can also be a phase shift in the preamp. So I will calibrate the system by reading the signal from a ferrite target. I would like to have ferrite fall on the negative x axis of the graph. The raw numbers coming out of the demodulator are about 110° away from where I want them.
If you consider the values from the demodulator to be a vector (x,y) all the vectors can be rotated by multiplying them by a rotation matrix. To rotate a vector by an angle A multiply by the matrix:
cos(A) -sin(A)
sin(A) cos(A)
To rotate them 110 degrees multiply by:
-.34 -.94
.94 -.34
If I name the rotated values Xr, and Yr this works out to:
Xr = -.34X -.94Y
Yr = .94X -.34Y
So I put these calculations in the program and let it display Xr, and Yr. This is what I got for a set of test targets:
Ferrite -15325, 360
Foil 400, 4155
Nickel 1887 4246
Zinc Penny 14852, 10853
Dime 16950, 6782
These number are plotted on the graph at the top.
In mathematics the angle 0 usually lies along the +x axis and angles are measured counterclockwise from there. But in metal detecting a different convention has developed. Discrimination controls are usually turned clockwise to discriminate out more conductive materials, and meters usually deflect to the right for more conductive targets, and higher VDI numbers are usually assigned to targets with higher conductivity. So I will be measuring angles in a clockwise direction, and I will use the +y axis as the 0 angle. This means that I will calculate the angle by taking arctan(x/y) rather than arctan(y/x). There will be some confusion no mater how I do it, but I think this way it will be less confusing for people familiar with metered detectors and especially the XLT. Calculating the phase angles of the 5 targets above this way, I get Ferrite = -89°, Foil = 5°, Nickel = 24°, zPenny = 54°, Dime = 68°.
Target angles will be spread over the range -90° to +90°. These should roughly correspond to White's -95 to +95 DC Phase values.
Robert Hoolko
