I have previously listed some tables of X,Y data from the detector and phase angles for some of the data samples. But I avoided showing the phase angle of the samples that had a negative Y value. That is because it is a little difficult to explain them.
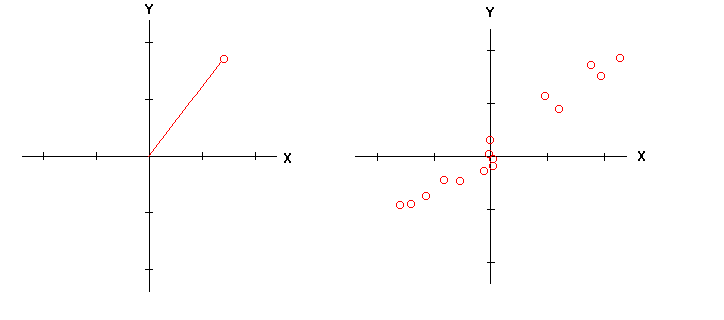
The graph on the left above shows a single data sample. It can be described by its X,Y components, or it can be described as a line with an angle and a length. The length of the line represents the strength of the signal, and the angle of the line is the phase angle of the signal. I am measuring the angle from the +Y axis.
In the graph on the right I have plotted 1/2 second of data from a single sweep of a penny across the coil at a distance of 5 inches. To avoid clutter I have not drawn the lines that would show the phase angles, but you can imagine lines drawn from the origin to each of the dots. One thing to notice is that the phase angles of the samples are not all the same. One reason is that the target has different phase angles when viewed from different directions. Another reason is that the X and Y signals are noisy. At greater distances from the coil the signals are weaker and the signal to noise ratio is lower. So the data samples tend to spread out more for weaker signals. A TID detector would usually pick out the strongest one of these samples and use that to ID the target.
When static measurements are made of the phase angles of various targets, from ferrite to highly conductive metal, the phase angles are spread over a range of 180 degrees. These can all be drawn in the top half of the graph. The values of Y are always positive. But if you pass the signal from a moving target through any filter that blocks DC the output of the filter will go both positive and negative. The X and Y signals are passed through filters to separate the slowly changing ground signal from the rapidly changing target signal. This causes the filtered X and Y signal to go positive and negative. So the phase angles of filtered signals are spread over 360 degrees. If you had an ideal target that gave only one phase angle the filtered signal from that target would sometimes have that phase and would sometimes be 180 degrees away. If you look at the graph on the right you can see that the -Y signals are about 180 degrees away from the +Y signals.
For now I am ignoring any signal with a negative Y. Another strategy for dealing with -Y signals is to reflect them through the origin. That is, if Y is negative invert both X and Y. This is a common practice, but it causes problems with noisy (weak) signals. Suppose you have a highly conductive target with a phase angle near +90 (deep silver). The Y value will be small and noise can make it go negative (the angle is greater than +90). If you then reflect that signal through the origin it comes out a little less than -90 which is in the iron or ground signal range. So deep silver can sound like iron. The same thing can happen with ground signals that are near -90. Noise pushes Y negative so the detector inverts the signals giving a phase angle just under +90 which looks like a good conductor.
Robert Hoolko
