Announcement

Collapse
No announcement yet.

IB Metal Detector Project, Part 33

Collapse
X
 
  • Filter
  • Time
  • Show
Clear All
new posts

  • IB Metal Detector Project, Part 33


    I have always wondered if the XLT VDI numbers were a linear function of phase angle. I had performed some simple tests from outside the box that convinced me that the XLT VDI's were almost linear. So I was willing to treat them as linear in other tests, but I was never sure. It is hard to tell without getting into the box.

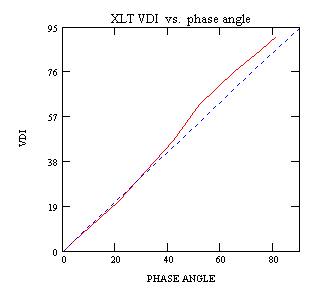
    So I used my detector project to measure the phase angle of 10 targets which had phase angles from 0 to 81 degrees and plotted the XLT DC Phase numbers versus phase angle. It turns out to be pretty close to linear. The red curve is the measured VDI's and the blue line is just a straight reference line (y=95/90 x).

    The XLT uses RC phase shift networks in the demodulator so two XLT's can easily disagree with each other by 2 or 3 VDI numbers. I suspect from other tests that my XLT reads about 1 number higher than it should at the ends of the scale. And I could have a couple of degrees of error in my phase angle measurements.

    Robert Hoolko

  • #2
    Re: IB Metal Detector Project, Part 33


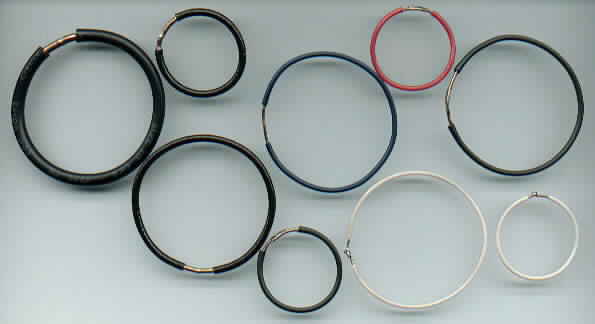
    As an addendum to Part 33: back when I first got the XLT and could not find out much about it, one of the things I wanted to know was the relationship between VDI and phase angle. But I did not know the phase angles of common objects, and could not figure out how to calculate the resistance and inductance of a coin shaped object. So I made a set of copper rings and calculated the resistance and inductance of each ring. That let me calculate what the phase angle of each ring should be at 6600 Hz. I thought I could use these as a set of calibrated targets.

    When I plotted the measured VDI against the calculated phase angle I got approximately the same graph I showed in Part 33. It did not seem plausible to me that the readings should fall on a straight line for part of the range and then bulge out for the rest. After re-checking my work a couple of times I decided I didn't really know what I was doing and gave up on the idea.

    Seeing this graph reminded me of those rings. I was able to dig up the rings and the table of calculated phase angles, and make new measurements of the phase angles. The calculated phase angles match the measured phase angles better than the VDI's do. So I am fairly confident that the bulge in the VDI's is really there.

    Robert Hoolko

    Comment

    Working...
    X