These are some illustrations of my last answer.

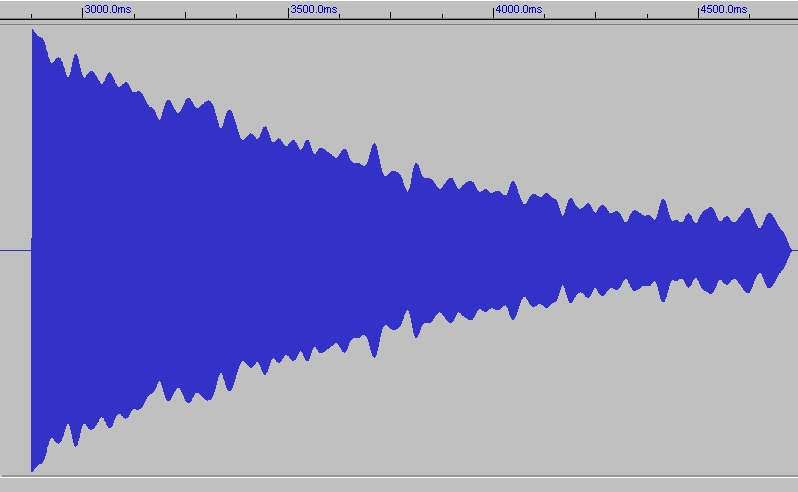
This is a typical PCM image of an exponential amplitude decay of a single sensor PMM with a GOOD amplification chain.

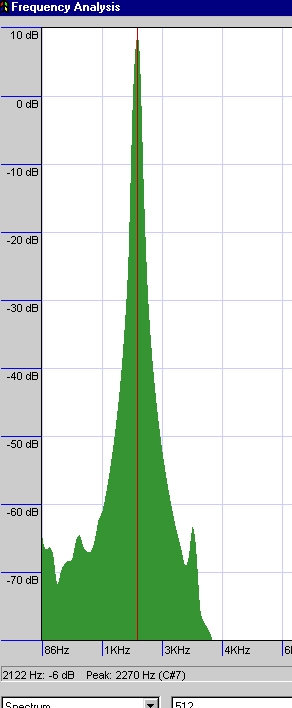
This is the corresponding FFT. Note the purity of the signal frequency and the very large peak at 2270Hz.

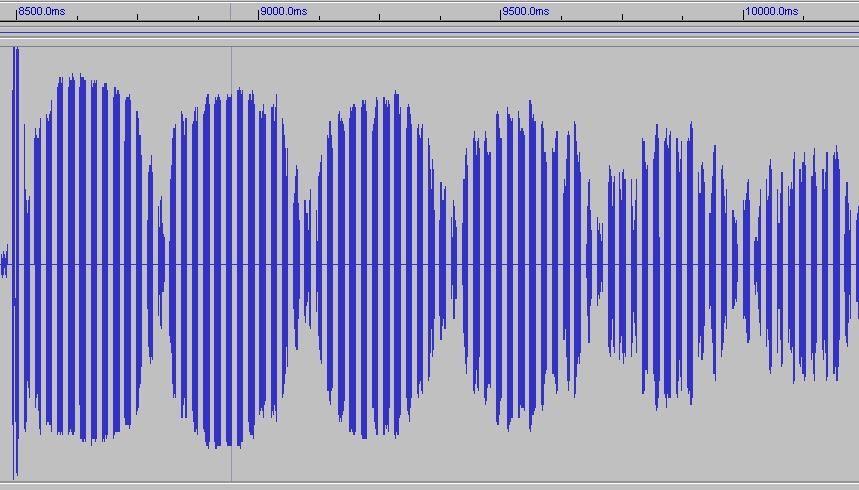
This is the PCM image of the AMplitude variations of the Phil's differential mag due to the signal ADDING from the two sensors. What you hear are these amplitude variations and NOT any frequency variation.

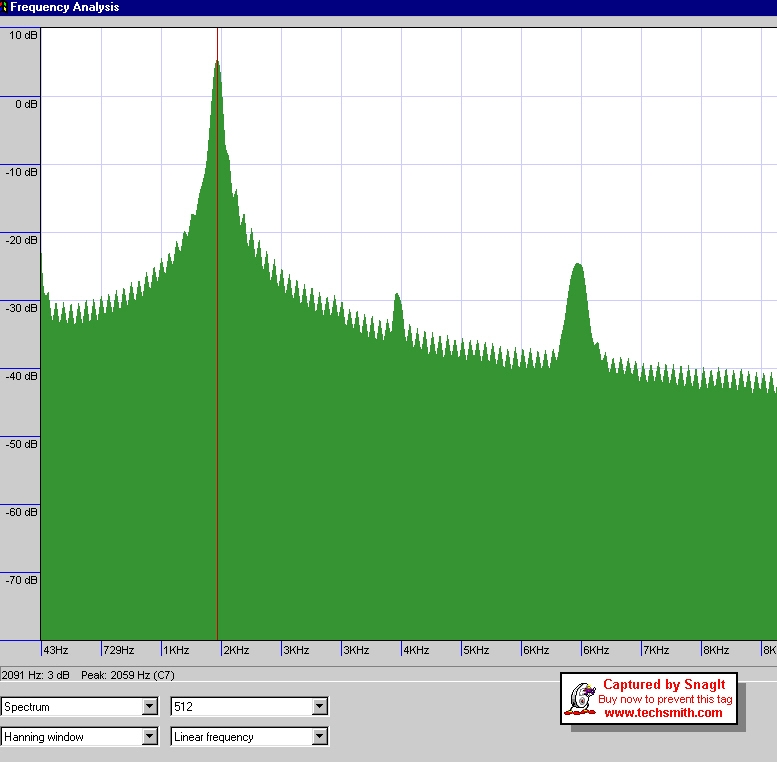
This is the corresponding FFT. Note the peak at 2059Hz surrounded by a numbe of harmonics due to the mixing of noise. Note that there is NO low frequency beat.

This is a typical PCM image of an exponential amplitude decay of a single sensor PMM with a GOOD amplification chain.

This is the corresponding FFT. Note the purity of the signal frequency and the very large peak at 2270Hz.

This is the PCM image of the AMplitude variations of the Phil's differential mag due to the signal ADDING from the two sensors. What you hear are these amplitude variations and NOT any frequency variation.

This is the corresponding FFT. Note the peak at 2059Hz surrounded by a numbe of harmonics due to the mixing of noise. Note that there is NO low frequency beat.
