Announcement

Collapse
No announcement yet.

gold nugget simulation?

Collapse
X
 
  • Filter
  • Time
  • Show
Clear All
new posts

  • Skin depth itself is straightforward, but how it manifests itself in a total reverse-field phase angle is where Bessel functions arise. The best sources for discussion of all this are books on non-destructive testing.

    BTW, the previous equations are valid for targets larger than the incident field. That is, edge effects are not considered. I am currently investigating this.

    Comment


    • Originally posted by Ferric Toes View Post
      Here is some more testing. This time on lead tape 0.19mm thick and 25.4 x 25.4mm square. %IACS readings are - 1off no reading, 2off 2.2, 3off 3.85, 4off 5.06, 5off 5.51, 6off 5.51 and so on for more squares. Total thickness for 5 squares = 0.95mm

      Next is copper tape; solid type 0.07mm thick and 25.4 x 25.4 mm square. %IACS readings are - 1off 7.75, 2off 27.5, 3off 46.8, 4off 56.9, 5off 57.0 and so on. Total thickness for 5 squares = 0.35mm

      Note as long as tape sample covers the sensor end, the area does not matter i.e. 0.5" square will measure exactly the same as a 1", a 2", or a 6" or more.

      Eric.
      Think I missed the obvious question. Lead has a %IACS of 8.4, copper 100. The meter didn't read those values at any thickness, is there a correction value based on thickness or something else to give the correct %IACS?

      Comment


      • A couple tests yesterday.
        nugget simulation_6
        Top chart with foil larger than coil. Decay time increases with increase in target size when targets are larger than coil size, Eric's meter doesn't change, any thoughts why?

        Bottom chart with target thickness greater than skin thickness at 100kHz. Copper plate doesn't chart straight line decay until around 200usec. If calculate frequency for skin depth=target thickness, then 1/frequency is about 200usec. I'm wondering if to get straight line linear-log decay starting at 10usec, target thickness needs to be around or less than skin thickness at 100kHz.

        nugget simulation_5
        Some formulas and calculations. Maybe someone could check if they are correct or should be written different.

        Thinking of trying some more tests. Maybe some targets .5, 1, 2 and 4times skin thickness at 100kHz. 2 or 3 different diameters. Any thoughts or suggestions?
        Attached Files

        Comment


        • Originally posted by Ferric Toes View Post
          That is an interesting experiment. I used 1" square pieces of regular foil (0.02mm). One square is too low to read. Two squares reads 1.8..............10 squares reads 25.00.........15 squares reads 38.0, and from then on it seems to be invariant. I have all the intermediate numbers up to 20 squares which is 0.4mm total thickness. Need to think about it more, but suspect it relates to the skin depth at 250kHz. (0.3mm at 15 squares).

          Eric.
          I calculate .14mm instead of .3mm skin depth for aluminum at 250kHz. Is either correct?

          Comment


          • 0.164mm ?

            Comment


            • Originally posted by Carl-NC View Post
              0.164mm ?
              What did you use for %IACS. I used 64.9 for .14mm skin depth that I searched. Tried searching again, 64.9 for pure aluminum foil. Found 1235 material used for kitchen foil, %IACS=57% calculates skin depth=.15mm if I'm calculating correctly, maybe not.

              Comment


              • Originally posted by green View Post
                Think I missed the obvious question. Lead has a %IACS of 8.4, copper 100. The meter didn't read those values at any thickness, is there a correction value based on thickness or something else to give the correct %IACS?
                The reason that the measured value of a metal does not reach the percentage expected is because of two things. Take the case of copper; the calibration sample on my Hocking meter reads 100%. My oldest copper coin is dated 1724 and reads 43.6%. A Victorian copper penny dated 1862 reads 17.7%. A 1965 copper penny reads 52%. All rather less than the 100% one might expect. Another example is silver, which is slightly more conductive than copper and could read up to 108%. I have a silver medallion stamped 99.99 fine. This measures 104%. Measure a US $2 silver coin and we only get 90.2%. If we doubled or trebled the thickness of the objects mentioned, the readings would remain the same. As you say, lead has an IACS of 8.4, and a 5lb diving weight reads at 8.1, which is very close. Aluminium is a different story. 99.9% pure aluminium has an IACS% of 64.94, but aluminium alloys can drop as low as 24%. I have a large ingot of the stuff that weighs 13lbs and this reads 25.6%. Bendable sheet 1.2mm thick reads 60.8% while machinable bar is 44.2%.

                Herein lies the problem. As IACS implies, annealed pure copper is used as an international standard of conductivity. Any hardening of the copper, or alloying with even small amounts of other metal will reduce the conductivity. This is certainly the case with coins, and most likely the copper emc tape I have is an alloy.

                The second problem is with thin sheets i.e. the kitchen foil. One interesting report I am reading recommends stacking; which is what we have been doing. More on that in another post as I have other things to do. Having a beer being one of them.

                Eric.

                Comment


                • Originally posted by Ferric Toes View Post
                  The reason that the measured value of a metal does not reach the percentage expected is because of two things. Take the case of copper; the calibration sample on my Hocking meter reads 100%. My oldest copper coin is dated 1724 and reads 43.6%. A Victorian copper penny dated 1862 reads 17.7%. A 1965 copper penny reads 52%. All rather less than the 100% one might expect. Another example is silver, which is slightly more conductive than copper and could read up to 108%. I have a silver medallion stamped 99.99 fine. This measures 104%. Measure a US $2 silver coin and we only get 90.2%. If we doubled or trebled the thickness of the objects mentioned, the readings would remain the same. As you say, lead has an IACS of 8.4, and a 5lb diving weight reads at 8.1, which is very close. Aluminium is a different story. 99.9% pure aluminium has an IACS% of 64.94, but aluminium alloys can drop as low as 24%. I have a large ingot of the stuff that weighs 13lbs and this reads 25.6%. Bendable sheet 1.2mm thick reads 60.8% while machinable bar is 44.2%.

                  Herein lies the problem. As IACS implies, annealed pure copper is used as an international standard of conductivity. Any hardening of the copper, or alloying with even small amounts of other metal will reduce the conductivity. This is certainly the case with coins, and most likely the copper emc tape I have is an alloy.

                  The second problem is with thin sheets i.e. the kitchen foil. One interesting report I am reading recommends stacking; which is what we have been doing. More on that in another post as I have other things to do. Having a beer being one of them.

                  Eric.
                  Beer sounds good.

                  Comment


                  • Eric, what is the thickness of your copper calibration sample? Is the diameter larger than the pickup?

                    Comment


                    • Originally posted by green View Post
                      Eric, what is the thickness of your copper calibration sample? Is the diameter larger than the pickup?
                      Calibration sample is 0.122" thick. and is a rectangular piece 1.0" x 2.5". This one piece is being the two circular holes in the plastic housing on the right of the front panel (see photo in earlier post). The active end of the probe is 0.4" diameter.

                      Eric.

                      Comment


                      • This paper gives a detailed explanation of eddy current testing of the conductivity of metals. MIL-STD-1537C (1).pdf It fits exactly the Hocking Auto-Sigma 2000

                        Page 9 has a graph of depth of penetration v frequency and IACS%. The top frequency is 200kHz, so you would need to extend the x axis and extrapolate the graphs out to 250kHz to accommodate the HF version of the Hocking, which is what I have. The section on thin materials and stacking is interesting.

                        Eric.

                        Comment


                        • Originally posted by Ferric Toes View Post
                          This paper gives a detailed explanation of eddy current testing of the conductivity of metals. MIL-STD-1537C (1).pdf It fits exactly the Hocking Auto-Sigma 2000

                          Page 9 has a graph of depth of penetration v frequency and IACS%. The top frequency is 200kHz, so you would need to extend the x axis and extrapolate the graphs out to 250kHz to accommodate the HF version of the Hocking, which is what I have. The section on thin materials and stacking is interesting.

                          Eric.
                          Interesting. Thought specimen minimum thickness would have to be around 4 or 5 times skin thickness, if I did the math correctly(minimum/skin, .131mm/.113mm)for copper, 1.16 times skin thickness, .131mm for the copper standard. Think I understand the stacked measurement, guessing on how to take unstacked measurement. Measure specimen a, b, and c each three times, add the 9 readings and divide by three?

                          Looks like might be an error in my math. Your reply gives .122mm thick for standard and I calculate .131mm for minimum thickness for copper standard.

                          Reread unstacked again, (a + b + c)/3?
                          Last edited by green; 12-25-2018, 11:01 PM. Reason: added sentences

                          Comment


                          • Think my second guess for unstacked probably correct. First guess was based on reply#196 where reading was effected by thickness and I missed that correction was for thickness as much as 40% below minimum. I calculate .164mm(IASC=64) and .232mm(IASC=32)for minimum thickness for aluminum, Eric needed .3mm for the reading not to change. Could someone check my math?

                            Comment


                            • I found what looks like a lead button, 30mm diameter x 2mm thick. According to my IACS chart lead should read 8.4% - 7.7%. I offset the button so that the holes were just outside the sense area of the probe.

                              Click image for larger version

Name:	Lead button.jpg
Views:	1
Size:	48.9 KB
ID:	352633

                              Next is a bronze disc 56% Cu and 43% Ni. 42mm diameter x 3.5mm thick. The nearest on my chart is 70% Cu and 30% Ni. and has an IACS of 4.5%.

                              Click image for larger version

Name:	Bronze disc.jpg
Views:	1
Size:	48.9 KB
ID:	352634

                              My sample has a has a higher percentage of nickel which has resulted in the lower reading of 3.64%.
                              Another test performed was on a square section aluminium bar 1" x 1" x 12". A reading of 52% IACS was obtained at the bar ends and also anywhere along the 12" length. This is within the correct range for machinable aluminium alloys.
                              I have confidence that the Hocking instrument gives accurate conductivity readings of the sample being tested, even if they are thin metal foils and tapes.


                              Eric.

                              Comment


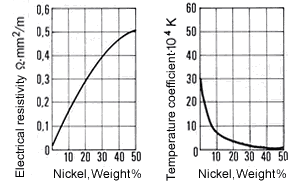
                              • Regarding that Cupro-nickel disc of Eric's, I came across this small graph showing how nickel percentage affects resistivity of Cu-Ni alloy:

                                ... from which you could take a reading of 0.475 for 43% Ni alloy. This translates to conductivity = 2.1 x 10⁶ ; or 3.6% IACS, as Mr Hocking indicates.

                                Also, reading up on Lead, it's surprising how common it is to alloy it with a small amount of Antimony, and even 1% Sb can significantly alter the conductivity reading, dropping down the IACS figure from the pure 8.4% to the mid-7's.

                                Comment

                                Working...
                                X