Announcement

Collapse
No announcement yet.

Arduino based VDI!

Collapse
X
 
  • Filter
  • Time
  • Show
Clear All
new posts

  • Piovra1981, thank you for the compliments!

    This is a VLF MD. For what I know, PI MD are very limited in metal identification.
    Anyway you should know many things about MD and their working principles, and you should know very well about electronics before to build a not so easy project like this VDI.
    My vdi has come after big experience building tgsl...his coil, his circuit...hours of reading in geotech forum. Using oscilloscope to investigate problems...to tune it...it was really a challenge for me! And I work in electronics!
    And TGSL is the best treated machine here in geotech forums! Many people built it...many problems solved together. Years of discussion! And someone can't solve some problems anyway!
    My VDI was not functioning from the first time... I follow the project very well but problems are insidious...behind the corner.
    Some months to get it to work...Daren knows the story...

    To add this vdi to garrett it should be reverse engineered like Daren said. Not so easy to understand a working principle of a MD! A schematic is not always clear.
    PCB of garrett is SMD, with tiny surface mounted components...very little tracks and pads. Nearly impossible to work on it for amateurs...the risk is high: short circuits, unwanted removal of components and so on.

    Arduino and display are very battery drain. You have to add an external battery to mantain a good operation time.

    I think you should consider to change your MD rather to invest your time on this project.
    Ace 250 mantains a good value in the time. You could sell it and buy another MD with numeric VDI, maybe teknetics eurotek pro:
    http://www.tekneticst2.com/teknetics...l-detector.htm

    Sorry but this is my honest opinion Piovra...

    Comment


    • Hello Manny77,
      thank you so much for your replay, i see the video you linked to me and ..... Oh my good !! ....
      I think you are right on teknetics , what do you think of new model euro pro with 11 DD ?
      I think this is a good metal, hope his VDI is valid.

      Comment


      • I never had a commercial MD Piovra. Only see Ace250 of my friend. I think that is good. Searching opinions and videos, for the same price Eurotek pro seems way better choice for me. It response very fast respect garrett, sound is not "ding ding" without information like ace250...it is very informative, "responding FAST" and rich! Vdi seems really good. Obviously this is an enter level MD...but I consider this for a possible buy...

        Before i link a video in my previous post. It was for alpha 2000. The model without vdi...
        Eurotek PRO has vdi and cost only a little more than alpha 2000.
        http://youtu.be/qQ_0S1ePJPQ

        Comment


        • I write C code for a living. I'm an embedded firmware engineer. I'll restructure the code a bit to get rid of the gotos. But as he code sits now, it appears to me that
          there might be an issue. You do a goto in the for loop. Depending on the compiler, that might result in the next execution of the for loop, in which case your count will be off, and your average won't be right
          The 0515 code is a bit clearer

          It still would be clearer if instead of the goto read in the for loop, you did a continue, and tracked the count of the good samples separately. In our product, I do a rolling average of 32 samples of our data. I chose a buffer implementation rather than a multiply. That is, I track the last 32 values, throw away the last one and recompute the average. This provides a good deal of smoothing, shortening the buffer makes it more sensitive. We use a bucket average like yours, for another part of the program, where I bucket average the same values.

          THIS DANG THING WONT ALLOW FORMATTING AND INDENTING.
          Each { needs to be indented 4 or 8 spaces. Don't know what is wrong with this input window, but I apologize for the non formatting...


          sensorValuex = analogRead(sensorPinx); //Read the analog pin A0 and store it's value as sensorValuex (it will be between 0 and 1023)
          sensorValuer = analogRead (sensorPinr); //Read the analog pin A0 and store it's value as sensorValuer (it will be between 0 and 1023)
          good_count=0;
          if (sensorValues > 5) && (sensorValuer >5) // only if the sensors are both > 5. do we do anything
          {
          // in the case of bad values, we just skip them, so the result is that when we exit this loop, we may not have 50 values.
          // to keep the average accurate, you need to know how many good passes you made
          for (int n = 0 ; n < 50 ; n ++) // starts a counter to read the sensors again in a loop 100 times
          {
          sensorValuex = analogRead(sensorPinx); //Read the analog pin A0 and store it's value as sensorValuex (it will be between 0 and 1023)
          sensorValuer = analogRead (sensorPinr); //Read the analog pin A0 and store it's value as sensorValuer (it will be between 0 and 1023)
          slope=sensorValuer / sensorValuex; // calculate X/R ratio and call it "slope"
          if (slope==0)
          {
          continue; // this will force the loop to start the next increment
          }
          else
          {
          slopeTotals=slopeTotals+slope;
          good_count++
          }
          }
          }
          //
          // coming out of this, the good_count will be the number of samples that you actually used.
          // I'd like to get this code into the arctan form, so we could have phase angles from - to +, as well as the numbers you have. This looks very much like it will work however.
          /'
          slopeAve = slopeTotals/good_count; // take all the slope values and average them.
          Last edited by scrungy_doolittle; 10-05-2014, 02:10 AM. Reason: formatting

          Comment


          • I'd do an if-then-else chain rather then goto's.
            But this is getting pretty good.
            Now, you can take this and make a set of notch rejection cases as well.

            Comment


            • Originally posted by scrungy_doolittle View Post
              THIS DANG THING WONT ALLOW FORMATTING AND INDENTING.
              The forum allows files with the ".txt" function to be attached. I suggest trying that, instead of simply pasting the code into the reply box.

              Comment


              • Could you please post the schematic that you used?
                I think the next evolution of this needs to be notch filters. I'm going to have to convert it to straight C though.
                C++ is not really suitable for the micros I use, and I've never bothered with C++. I wish it was straight C.
                Additional questions: it uses a menu system, where is the code for that?

                Comment


                • That graph is killer. Gotta see how you do that I use one of these on the medical device I write the code for... wanted to do a graph like this, but could not find the characters. Wound up using user defined characters for some of the custom symbols, but never figured out a clean way to do graphs. This rocks.

                  Comment


                  • Nice. How many times have you started hunting, and when you get ready to quit find you have been at it for 2 hours and never noticed that? Not good when you are out on your lunch hour How about a clock instead of the voltage level?

                    Comment


                    • The two comments yesterday were on the original code that Don posted..... Just for the record. The latest code is pretty sweet.
                      I try to avoid floating point in micros, because it is rather slow, but that is because I use 8051's even if they are running at 24 MHz, with a core that has 1 clock per byte of instruction, for most instructions, and runs with 40 ns clock.
                      I work with Silabs F040. 64K flash, 4 k ram, nice adc/dacs, (but I don't use them). We produce a damped sinusoidal waveform that swings from about +500v to -500 v at nano amps at the maximum, using a flyback transformer. This is used to supply stimulation pulses for an electronic pain killer. Much like a PI detector. The ringing is damped by the capacitance and resistance of the skin, and we use that to measure changes to the body.... I'm thinking the same technique might be used for a PI detector. The lower the conductivity, the narrower the signal.

                      Comment


                      • Originally posted by scrungy_doolittle View Post
                        That graph is killer. Gotta see how you do that
                        scrungy_doolittle: if you are referring to the graph on the 16x2 LCD here is the relevant code:
                        m_lcd is Arduino's LiquidCrystal_I2C or LiquidCrystal library object
                        (BTW: all code for this project is posted in this thread: post #116

                        16x2 allows for 8 custom characters; they are used to create graphics

                        //data: array of 40 values 0 to 7
                        void CVDILcd::lcdGraph(int row, int column, unsigned char data[40])
                        {
                        unsigned char b[8][8] = {{0}};
                        for(int n=0;n<40;n++)
                        {
                        int h = data[n];
                        if(h>7) h=7;
                        if(h<0) h=0;

                        int c = n/5;
                        int pc = 4-n%5;
                        for(int r=7;r>=(7-h);r--)
                        {
                        b[c][r] |= 1<<pc;
                        }
                        }

                        for(int n=0;n<8;n++)
                        {
                        m_lcd->createChar(n, b[n]);
                        }

                        m_lcd->setCursor(row, column);
                        for(int n=0;n<8;n++)
                        {
                        m_lcd->write(n);
                        }
                        }

                        Comment


                        • Thanks Daren, drop me a pm, and I'll give you my email. I have some ideas to make this vdi even niftier. Problem is I don't do arduino or C++, so I'll have to recast it into C. I have an LCD library I wrote for the 8051. I'd like to find the source for all libraries used. I write embedded code for a living, pure Keil 8051 C. I predefine 5 characters for custom characters, but where I would like to have a graph, the user defined characters are not used. Never occurred to me to rewrite them on the fly like this, but after analyzing the code, and removing the in-line variable declarations it makes perfect sense.

                          There is one question though. The data is an array of 40 character 0 to 7. and they are unsigned. Not sure why you are assigning them to an integer, but testing for <0 doesn't make any sense on an 8051. Unsigned by defintion, especially if the values are only 0 to 7, means that they are positive. So a test for <0 and then assign it to 0 doesn't seem to make sense, even if there might be a possibility of bad data. Me, I'd just do data[n] & 0x07; which will make sure the values are ONLY in the range of 0-7.

                          Been bit way to many times by comparing signed to unsigned, and a <= is a signed compare....

                          I think I'd rather see a realtime clock, then the battery, or else show the battery for 1 second every 30 seconds or so, and the time the rest of the time.
                          The device I develop programs for happens to use a 2 x 12 display, and an Silabs 8051F040, so I have my own 4 bit interface code for the LCD, which includes writing characters, strings, lines, and screens, as well as programming custom character codes. The other things that I feel would be really useful would be the x phase reading, the Y phase reading and the G reading.
                          (note I have whites 4900 and 5900's. The 4900 I want to put a VDI on. The 5900 already has a VDI.) And I am fixing to build an IDX and perhaps a TSGL. Fitting stuff into 12 characters is
                          a challenge.

                          zz ppp XX:XX ppp =+/-xx phase
                          sss ggggggg

                          zz = zk (zinc) cp (copper penny) (ni) nickle dm (dime) qr (quarter) gd (gold) sv (silver) pt (pop tab) ir (iron) XX:XX time of day SSS signal strength and gggggg the graph.

                          diag display
                          zz ppp xx:xx
                          gnd yyy xxxx gnd= ground reading yyy = y reading xxx= reading

                          http://www.ebay.com/itm/like/231352091016?lpid=82 a current link to the device I write code for. Not sure how it is getting on ebay.... that is a prescription device...
                          http://microcurrent4people.com/prosport.php

                          I basically want to port the code over to this device, since I have a bunch of engineering versions that can't be sold, and a few cases.. All for my own use.
                          I'll be glad to contribute the code back to this thread though.
                          Last edited by scrungy_doolittle; 10-13-2014, 01:18 AM. Reason: added

                          Comment


                          • The one thing I did not see in the zip file, is how the encoder hooks up. Where is that defined in the code? It isn't in the encoder.h file, which is where I assumed it would be.
                            I think it would be nice to have a complete schematic. One of the things I've been toying with is that it seems to me that you could save the X and Y data, then run through it 3 times. One searching for the maximum X and maximum y, the minimum X and minimum Y and use those two end points to compute the phase angle. Since most of these signals look like a quashed loop on the scope, scanning the X array, looking for the maximum value BEFORE the end point, and scanning the array, looking for a maximum value before the end point, should allow you to compute two more angles. One would be the upper phase range, and the lower phase range, so you would perhaps get a +71 for the main vector, and a +66 and a +78, as an example, for bounding ranges, and thus derive a phase angle range. This could then be run through a simple fuzzy inference engine to get a quite accurate description.
                            Fuzzy logic is ideal for these kind of things. It basically expresses a set of rules as functions of a trapezoid, establishes the amount of membership (essentially the percentage that the item is within one range, and the percentage it is in a second range, then defuzzifies it to a crisp value. It is NOT A PERCENTAGE however. The concept is kind of hard to grasp, but it is very powerful for these sorts of problems. If the angle is above x and below y, and it is a bit more to the left of center than it is to the right then the probability of it being a nickle is xxx and a tab is xxx.
                            http://en.wikipedia.org/wiki/Fuzzy_logic this is a good explanation. Phase angles and metal identification fall neatly into this kind of a scheme.
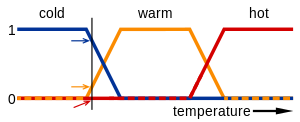
                            substitute pennies, dimes and quarters for cold warm and hot, and the range of each on the x axis, is the phase angle range read from the meter to get an idea of what I am proposing here.


                            It is essential to realize that fuzzy logic uses truth degrees as a mathematical model of the vagueness phenomenon while probability is a mathematical model of ignorance. Applying truth values[edit]

                            A basic application might characterize subranges of a continuous variable. For instance, a temperature measurement for anti-lock brakes might have several separate membership functions defining particular temperature ranges needed to control the brakes properly. Each function maps the same temperature value to a truth value in the 0 to 1 range. These truth values can then be used to determine how the brakes should be controlled.
                            Fuzzy logic temperature


                            In this image, the meanings of the expressions cold, warm, and hot are represented by functions mapping a temperature scale. A point on that scale has three "truth values"—one for each of the three functions. The vertical line in the image represents a particular temperature that the three arrows (truth values) gauge. Since the red arrow points to zero, this temperature may be interpreted as "not hot". The orange arrow (pointing at 0.2) may describe it as "slightly warm" and the blue arrow (pointing at 0. "fairly cold".

                            Comment


                            • can you please provide PDF for IDX used , can i use coil 1*1 M

                              Comment


                              • This all good stuff, fairly sure it will go onto any simple 2 ch machine, idx

                                I would have liked to be able to code better, Im just not wired that way, I think in pictures and write in crayon

                                Comment

                                Working...